PCA
Consists in decomposing the principal components of observations (i.e., a set of values of linearly uncorrelated variables).
This transformation is defined in such a way that the first principal component has the largest possible variance (that is, accounts for as much of the variability in the data as possible), and each succeeding component in turn has the highest variance possible.
Usually done/implemented through SVD method that is computationally efficient.
Interesting course avaialble in Zotero if link is dead
Biplot
Allow to plot the principal component axes, used to see the correlations between variables.
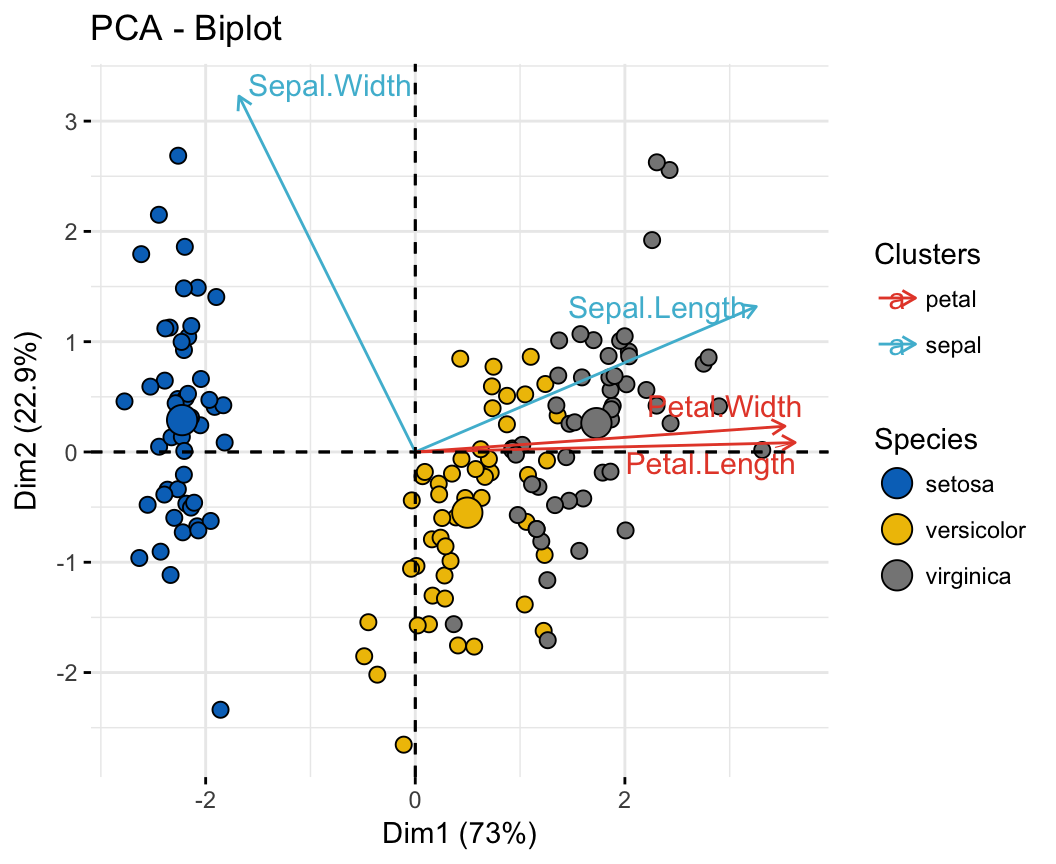
In this example, Petal.Width and Petal.Length are positive vectors and point in the same direction, it means they are highly correlated.
Sepal.Length and Sepal.Width are orthogonal, it means they have no correlation.
In other words:
- positive correlated variables are groupped
- negative correlated variables are opposed
- orthognal variables are uncorrelated
Note: we consider that observations (data) are linear. Else this observation could be biased (see other methods).